1.0 hunting & how we learn
Imagine you are a skilled hunter, setting out to track deer in the wilderness. To succeed, you need to determine the size of the deer and the direction it has traveled. The process involves closely examining the tracks and signs left behind. By interpreting these clues, you can follow the trail and find your target.
In trading, the approach is quite similar. Just as a hunter reads tracks to locate their game, traders analyze market signals to make informed decisions. Today, we will learn how to read these ‘tracks’ in the financial markets, enabling us to efficiently and effectively find profitable opportunities.
1.2 Market Trends
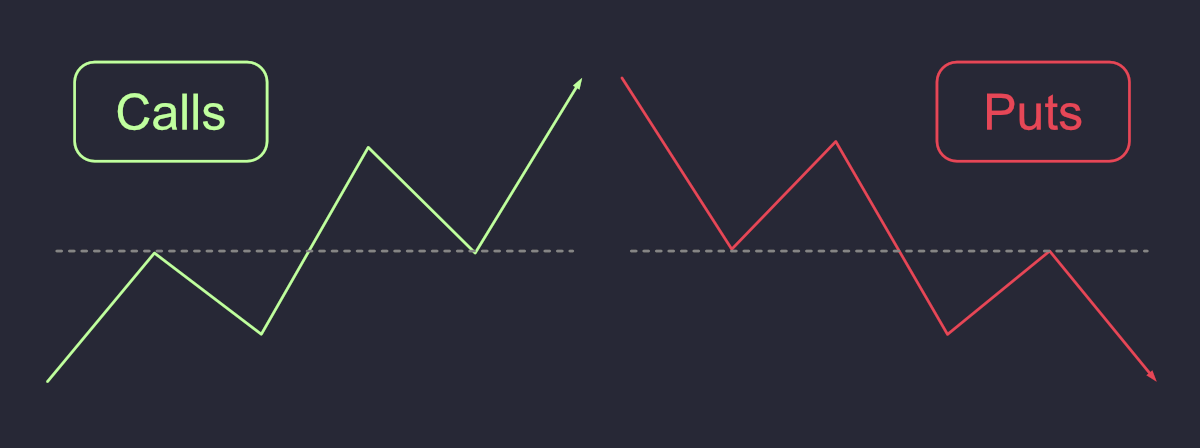
Bull Market
A Bull market gest its name because bulls attack with an upward swing of their horns. Bullish investors are those who are very optimistic about the future.
In a bull market, you are "bullish" and are going along with "calls"
Bear Market
Bear markets are called because of the downward paw strikes of a bear. Bearish investors are those who are very pessimistic about the market and expect to see lower prices.
In a bear market, you are "bearish" and are going along with "puts"
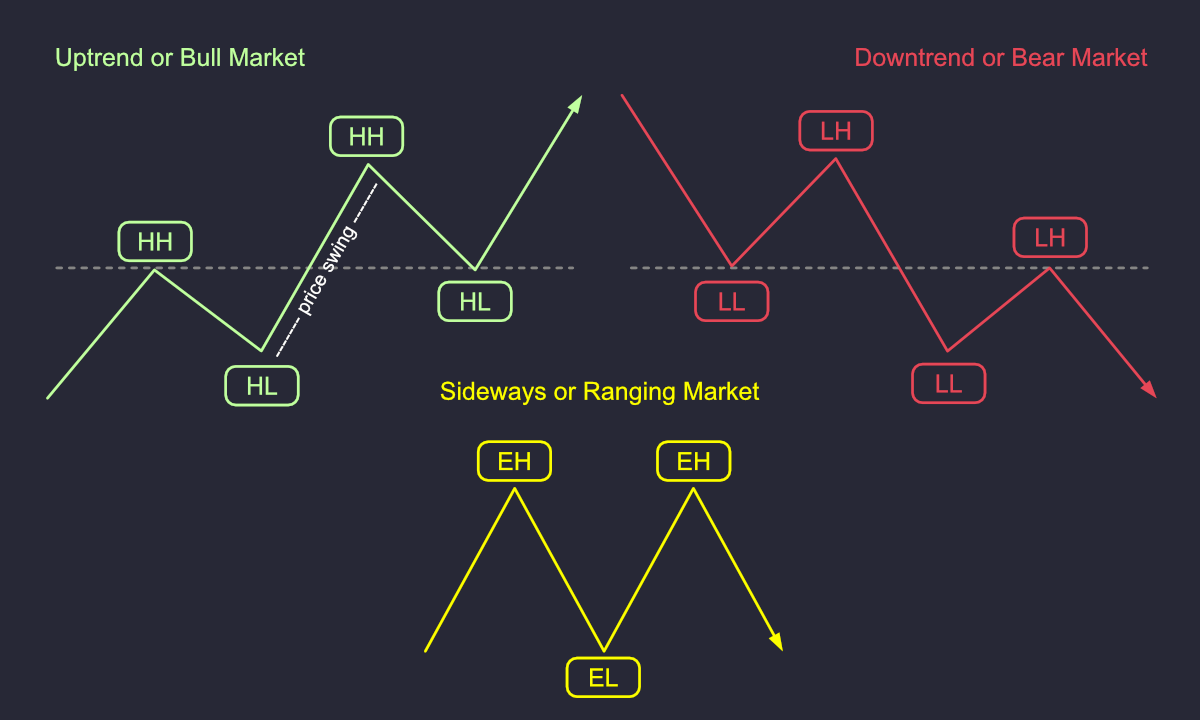
1.4 Market Structure
Market structure is the foundation of successful trading, providing a clear framework for understanding price movement and market behavior. It consists of key levels—swing highs and lows—that indicate when the price changes direction from upward to downward, or vice versa. These shifts in price action are essential to recognize, as they reflect the underlying supply and demand dynamics driving the market. Rather than trying to predict every move, traders should learn to flow with the market’s structure, adapting to its natural rhythm.
While predicting every move is impossible, market structure offers a clear framework to understand and navigate erratic price behavior which is influenced by multiple factors.
There are 3 directions in market structure:
Bull trend: characterized by price making consistent higher highs (HH) and Higher Lows (HL)
Bear Trend: when price makes consistent lower highs (LH) and lower lows (LL)
Range or consolidation: is when the price cannot make a higher high or lower low, and at best it prints an equal high (EH) or an equal low (EL)
Bear Trend: when price makes consistent lower highs (LH) and lower lows (LL)
Range or consolidation: is when the price cannot make a higher high or lower low, and at best it prints an equal high (EH) or an equal low (EL)
1.6 The four Market phases
A market phase refers to the current trend or general direction of the market. When looking at the big picture, the market has been in a continuous advancing stage over time.
Here are the four key market stages:
Accumulation phase
This stage occurs after a downtrend and looks like a sideways or ranging market. Buyers slowly start stepping in, but prices haven't yet begun to rise significantly. It’s a period of consolidation before an uptrend.
Macro Strategy: Accumulate positions gradually as the market ranges and shows signs of bottoming out. Focus on identifying strong support levels and buying near them, keeping risk tight. Look for increasing volume on upward moves as a signal of potential trend reversal.
Advancing phase
The advancing phase is marked by an uptrend, with prices making higher highs and higher lows. This is an ideal phase for trading long positions, buying calls, or investing in long-dated expiration options as the market shows strength.
Macro Strategy: Buy the dips as volume expands on breakouts, and focus on holding long positions during higher highs and higher lows. Ride the uptrend, and add to positions on pullbacks while managing risk with trailing stops or support levels.
Distribution phase
In the distribution phase, prices move sideways within a range after an uptrend. It signals that the uptrend may be losing momentum as traders start taking profits and sellers begin entering the market.
Macro Strategy: Take profits on existing long positions as the market begins to range and shows signs of exhaustion. Avoid initiating new long positions. Watch for a shift in volume or momentum as potential signals for a trend reversal and prepare for a possible transition to a declining market.
Declining phase
This is a downtrend where prices make lower highs and lower lows. It’s a period where selling dominates, and the market weakens, presenting opportunities for short trades, puts, or other bearish strategies.
Macro Strategy: Short the rallies or buy put options as prices make lower highs and lower lows. Focus on capitalizing on downside momentum, and consider adding to short positions on retracements. Protect profits with tight stops, and monitor for potential signs of bottoming or transition to accumulation.

Time (Market Structure) represents when the market is in a favorable position for a trade, such as during a clear trend or after a significant support/resistance level has been tested. It's about determining whether the current market structure indicates a good time to go long or short.
1.8 trading styles

Scalping
Risk: High, must be watching trade.
Timeframe: Seconds to minutes
Objective: Capture momentum and close intraday
Risk: High, must be watching trade.
Timeframe: Seconds to minutes
Objective: Capture momentum and close intraday
Day Trading
Risk: Medium. Best to be watching positions
Timeframe: Minutes to hours.
Objective: Capture half or full moves intraday.
Risk: Medium. Best to be watching positions
Timeframe: Minutes to hours.
Objective: Capture half or full moves intraday.
Swing Trading
Risk: Low-medium. Check the price periodically for confirmation
Timeframe: Overnight or multiple days
Objective: Hold positions overnight or several days.
Risk: Low-medium. Check the price periodically for confirmation
Timeframe: Overnight or multiple days
Objective: Hold positions overnight or several days.
Position Trades
Risk: Dollar cost averaging into a position
Timeframe: Months to years
Objective: Buy low, sell high. Hold positions for months to years at a time
Risk: Dollar cost averaging into a position
Timeframe: Months to years
Objective: Buy low, sell high. Hold positions for months to years at a time
1.10 Market hours: Utah
Pre-market: before 7:30 AM (no options trading during this time)
Market Hours: 7:30 AM - 2:00 PM (6 hours, 30 minutes of live market)
some indices trade until 2:15 PM (SPY, QQQ, IWM)
After-market Hours: 2:00 PM - 4:00 PM Earnings calls volatility and expiring contracts are closed
Market Hours: 7:30 AM - 2:00 PM (6 hours, 30 minutes of live market)
some indices trade until 2:15 PM (SPY, QQQ, IWM)
After-market Hours: 2:00 PM - 4:00 PM Earnings calls volatility and expiring contracts are closed
Best Time for trading: 7:30 AM - 9:00 AM (Opening hour, Most volatility and Liquid market)
Second Best Time for Trading: 1:00 PM - 2:00 PM (Liquidity is back in the market in the last hour)
Second Best Time for Trading: 1:00 PM - 2:00 PM (Liquidity is back in the market in the last hour)
Time is critical in trading, as it influences volume, volatility, and personal performance. Key hours, like the market open and close, offer heightened activity, while certain days bring greater volatility due to economic events. Knowing when you perform best allows you to align your strategy with the market’s rhythm, maximizing your effectiveness after all trading is a performance-driven game.
Summary
In the TPO formula, time represents the ideal periods to trade based on market structure and conditions. Time is reflected on the bottom axis of a chart and highlights the importance of trading aligned with the market's direction, whether bullish or bearish. Certain windows of time offer higher volatility and better opportunities, making it essential to understand how market structure influences when to trade effectively.
🙌 congrats you have completed the concept of timing! 🙌
Options Market
An option contract is a derivative that gives you, the buyer the right, but not the obligation to buy or sell the underlying asset at a given price (strike) on a specific date (expiration date). We will focus on debit option contracts.
Options give traders and investors a way to leverage their money without having to take on margin. Margin is a loan approved to use in the stock market. This is because an option contracts has control of 100 shares of the stock.
Not only does this maximize returns It also limits losses made on the move inside the stock. It also allows you to put less money into a trade to potentially make more money from the trade.

Option of ABC stock at 150 strike expiring 1/23/2024 priced at $150 per contract.
From left to right:
Ticker
A stock ticker is a short abbreviation for a stock.
these are unique to the stock.
these are unique to the stock.
The Strike Price
The strike price or the exercise price is the price at which the option holder can buy or sell a security when the contract is exercised.
ITM: in the money contracts with a strike price less than the current stock price. In CALL options these are the most expensive. Often Used in Swing Trading. Less Liquid over time.
ATM: at the money contracts with a strike price closest to the current stock price. In CALL options these are the second most expensive. Often used in SCALP Trading.
OTM: out of the money contracts with a strike price above the current stock price. In CALL options these are the cheapest contracts and carry the most risk nearing the date of expiration. Often bought in Day Trading and Swing Trading with longer expiration dates.
and the inverse is true for PUT option contracts.

Type of Contract
Calls (a Buy contract): is making a bullish bet.
Puts (a Sell contract): is making a bearish bet.
The Expiration Date
Options contracts are subject to the time of expiration which could be two days or two years.
The Price of an Options Contract
Options are priced according to market makers and the Greeks, a set of variables controlling the contract's sensitivity to the underlying asset.
Delta- is the change in the option's price due to the change in the stock price.
Gamma- estimates the change in Delta, or speed of price changes in the option's contract
Theta- is the rate of decline in the option's price due to the passage of time.
Gamma- estimates the change in Delta, or speed of price changes in the option's contract
Theta- is the rate of decline in the option's price due to the passage of time.
For example, if you see Microsoft bullish on the day, you would buy calls after your confirmation to capitalize off the bullish movement to the upside.
[Tip] As a trader becomes more aware of their unique risk profile, typically they will associate themselves with a specific amount of time preferred on a contract for a given trade, depending on how volatile they want their position to be.
Candles and Price action [Up next...]

Apple's 30 minute candlestick chart showing key trading areas.
X.I Market terminology
Long: means you have bought a financial asset, such as a stock, expecting its price to rise so you can sell it later for a profit. Essentially, you profit when the asset’s price goes up.
Short: means you have sold an asset you don’t own, expecting its price to drop so you can buy it back at a lower price, pocketing the difference. In this case, you profit when the asset’s price goes down.
Position: current holdings a trader has open. Long XYZ or Short ABC
Portfolio: Mostly used by investors when they refer to their equities holdings.
(Trading) Account: mostly used by traders when they refer to their brokerage accounts.
ATH: All time high


